
Phoenix Education Partners (PXED) has drawn fresh attention after recent trading left the stock at US$28.39. Negative returns over the past week, month, past 3 months, and year to date are prompting closer scrutiny.
See our latest analysis for Phoenix Education Partners.
The recent 10.47% one day share price decline caps a broader loss of momentum, with the 90 day share price return of 20.48% and year to date share price return of 4.31% both in negative territory.
If Phoenix Education Partners has you reassessing your options, this could be a useful moment to widen your watchlist and check out fast growing stocks with high insider ownership.
With Phoenix Education Partners trading at US$28.39, alongside an analyst price target of US$45.13 and an indicated intrinsic discount of around 82%, you might wonder whether this weakness signals an undervalued entry point or whether the market already reflects its future growth.
Price-to-Earnings of 9.9x: Is it justified?
On a P/E of 9.9x at a last close of US$28.39, Phoenix Education Partners screens as cheaper than both its Consumer Services industry and its direct peer group.
The P/E multiple compares the current share price to earnings per share, so it effectively shows how much investors are paying for each dollar of earnings.
For a business centred on online higher education and employer talent solutions, a lower P/E can suggest the market is pricing in more cautious expectations around earnings quality, especially where there have been large one off items and recent negative earnings growth.
Against that backdrop, the gap is wide. PXED trades on a 9.9x P/E versus about 17x for the broader US Consumer Services industry and around 41x for its peer group. This is a sizeable discount that points to materially lower expectations than those implied for comparable companies.
See what the numbers say about this price — find out in our valuation breakdown.
Result: Price-to-earnings of 9.9x (UNDERVALUED)
However, the recent negative 1 day and 90 day returns, alongside cautious expectations around earnings quality, suggest sentiment could remain fragile if results disappoint.
Find out about the key risks to this Phoenix Education Partners narrative.
Another View: what does the SWS DCF model say?
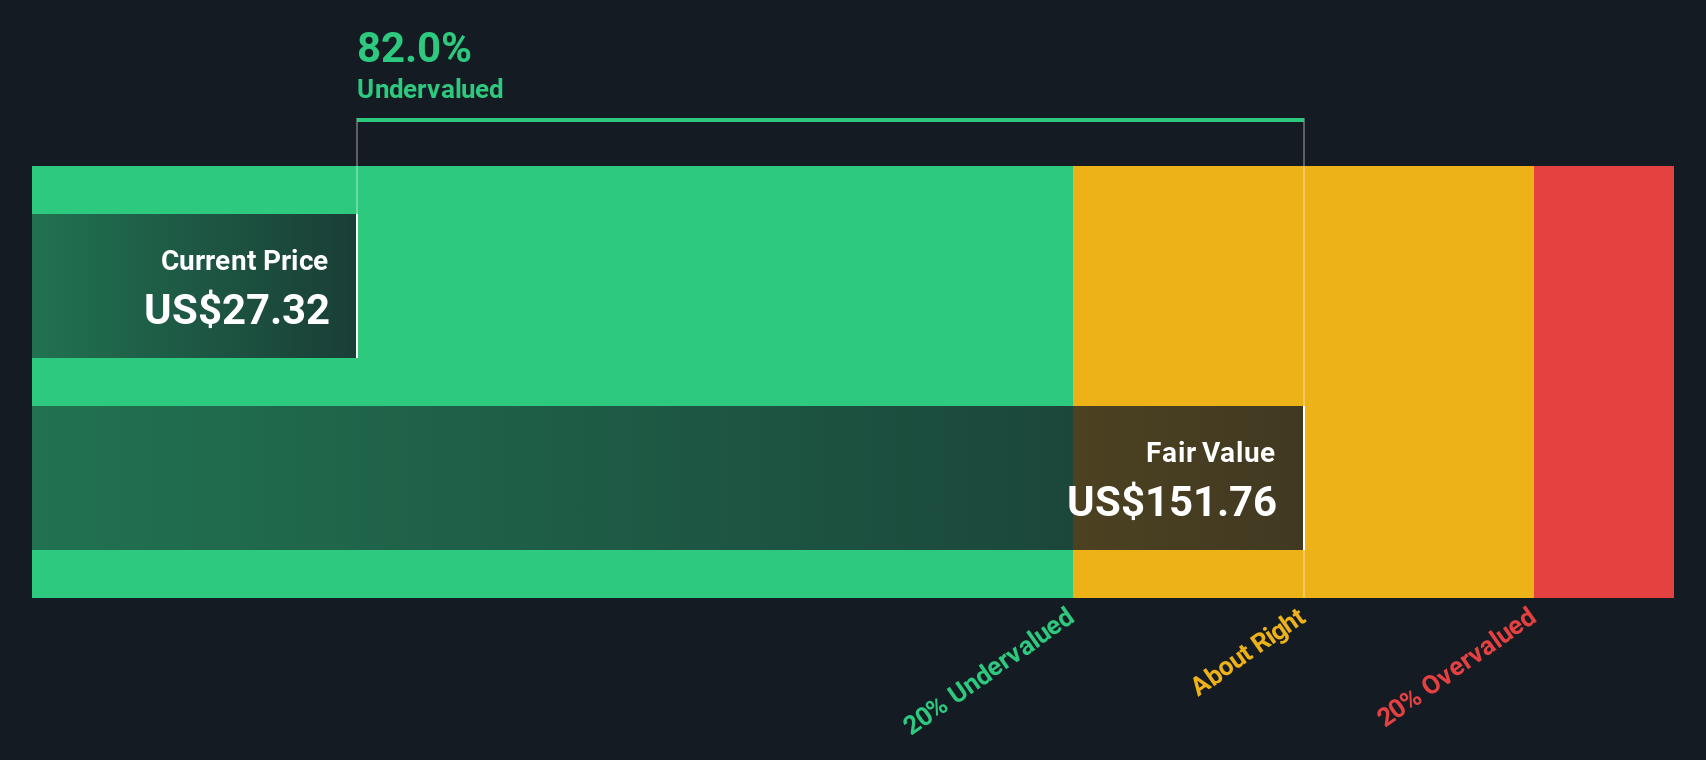
While the 9.9x P/E points to a relatively low earnings multiple, our DCF model indicates a much larger difference between the current share price and an estimated fair value of US$159.37 for Phoenix Education Partners, implying the shares are trading at 82.2% below this estimate. This is a substantial gap, which raises the question of whether the stock represents an opportunity or a potential value trap.
Look into how the SWS DCF model arrives at its fair value.
Simply Wall St performs a discounted cash flow (DCF) on every stock in the world every day (check out Phoenix Education Partners for example). We show the entire calculation in full. You can track the result in your watchlist or portfolio and be alerted when this changes, or use our stock screener to discover 887 undervalued stocks based on their cash flows. If you save a screener we even alert you when new companies match - so you never miss a potential opportunity.
Build Your Own Phoenix Education Partners Narrative
If you see the numbers differently, or prefer to rely on your own research, you can build a custom view of Phoenix Education Partners in just a few minutes, starting with Do it your way.
A great starting point for your Phoenix Education Partners research is our analysis highlighting 4 key rewards and 1 important warning sign that could impact your investment decision.
Looking for more investment ideas?
If you want to keep sharpening your watchlist, now is the time to scan fresh opportunities across sectors using the Simply Wall Street Screener.
- Spot potential value ideas by reviewing these 887 undervalued stocks based on cash flows that may trade at prices below what their cash flows imply.
- Capture the next wave in automation and data by checking out these 25 AI penny stocks focused on artificial intelligence themes.
- Tilt your portfolio toward income by scanning these 12 dividend stocks with yields > 3% that already offer yields above 3%.
This article by Simply Wall St is general in nature. We provide commentary based on historical data and analyst forecasts only using an unbiased methodology and our articles are not intended to be financial advice. It does not constitute a recommendation to buy or sell any stock, and does not take account of your objectives, or your financial situation. We aim to bring you long-term focused analysis driven by fundamental data. Note that our analysis may not factor in the latest price-sensitive company announcements or qualitative material. Simply Wall St has no position in any stocks mentioned.
Have feedback on this article? Concerned about the content? Get in touch with us directly. Alternatively, email editorial-team@simplywallst.com