
White Mountains Insurance Group (WTM) has drawn fresh attention after reporting fourth quarter and full year 2025 results that shifted from prior year losses to profits, along with ongoing activity in its long running share repurchase program.
See our latest analysis for White Mountains Insurance Group.
The earnings rebound and ongoing buybacks appear to be feeding into momentum, with a 1 day share price return of 1.78% and a 90 day share price return of 13.37%, while the 5 year total shareholder return of 80.97% suggests investors who stayed invested have been rewarded over a longer horizon.
If this update has you thinking about what else is working in financials and beyond, it could be a good moment to broaden your search with 23 top founder-led companies.
With profits back in focus and the buyback program still active, the real question is whether White Mountains Insurance Group is trading below its intrinsic value or if the market is already pricing in future growth.
Preferred P/E of 4.8x: Is it justified?
On the surface, White Mountains Insurance Group trades on a P/E of 4.8x, well below both the broader US market and its insurance peers, even after the recent share price strength.
The P/E multiple compares the company’s share price to its earnings per share, so a lower figure often suggests investors are paying less for each dollar of current earnings. For an insurance and financial services group like White Mountains Insurance Group, this is a quick way to see how the market is weighing its profit base against peers that face similar regulatory and underwriting conditions.
WTM screens as good value on this measure, with its 4.8x P/E sitting below the US market’s 19.4x and the US Insurance industry’s 12.5x. That is a clear gap. For anyone following the stock it raises a simple question: is the market applying a discount because of factors such as earnings quality and one off items, or is it underpricing the company’s profit power after a very strong rebound?
See what the numbers say about this price — find out in our valuation breakdown.
Result: Price-to-Earnings of 4.8x (UNDERVALUED)
However, you still need to watch for any earnings driven by one off items, and remember that buybacks eventually slow if cash needs or opportunities change.
Find out about the key risks to this White Mountains Insurance Group narrative.
Another take from our DCF model
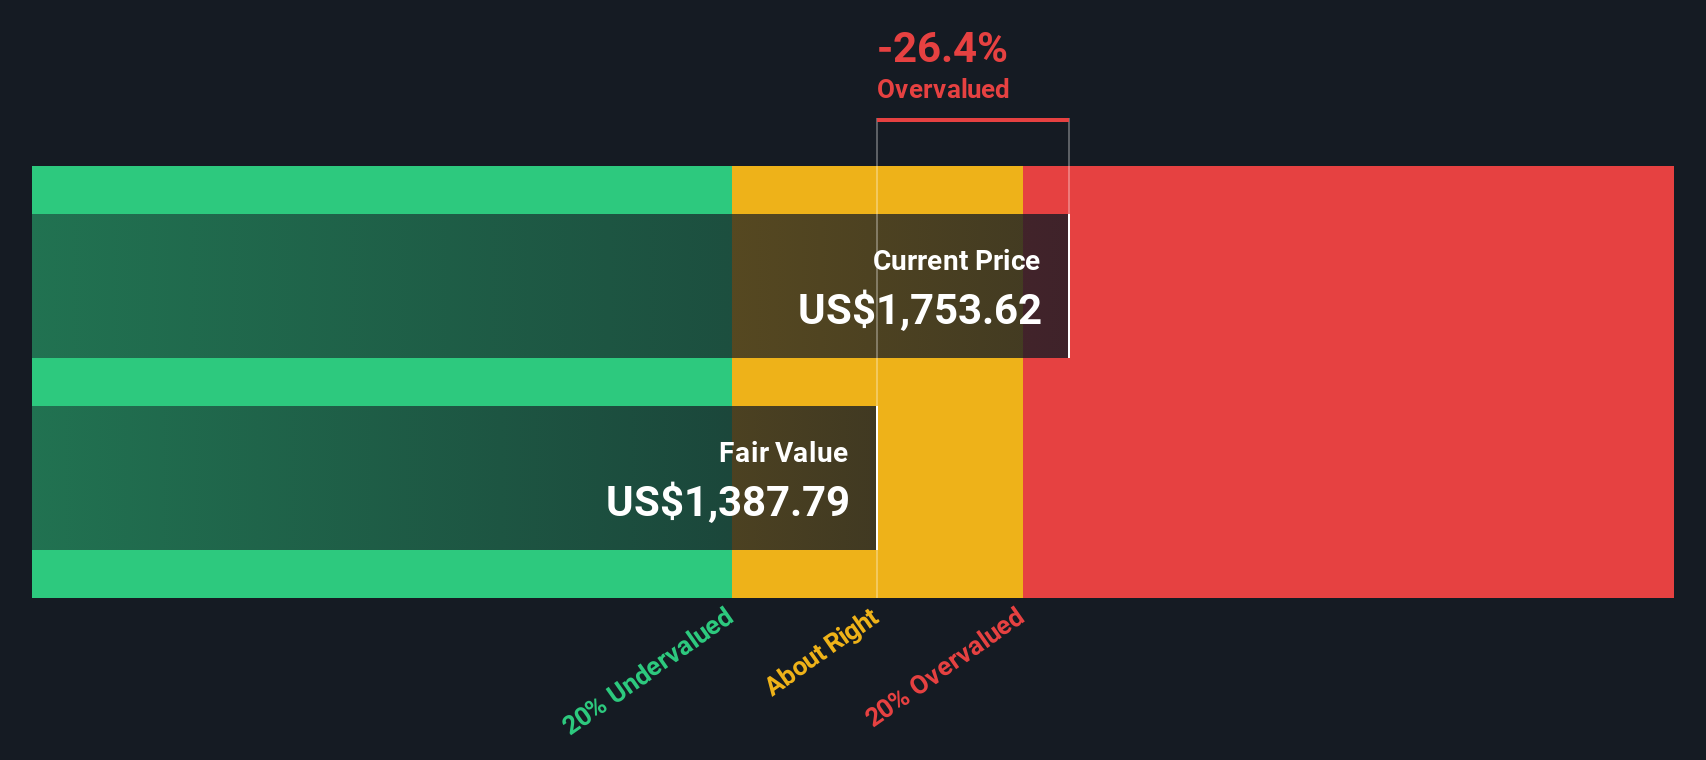
There is a twist when you switch from the simple P/E comparison to our DCF model. On this view, White Mountains Insurance Group at $2,182.01 is trading above an estimated future cash flow value of $1,187.52, which points to an overvalued result rather than a bargain. Which lens do you rely on more for your own assumptions on WTM?
Look into how the SWS DCF model arrives at its fair value.
Simply Wall St performs a discounted cash flow (DCF) on every stock in the world every day (check out White Mountains Insurance Group for example). We show the entire calculation in full. You can track the result in your watchlist or portfolio and be alerted when this changes, or use our stock screener to discover 55 high quality undervalued stocks. If you save a screener we even alert you when new companies match - so you never miss a potential opportunity.
Build Your Own White Mountains Insurance Group Narrative
If you look at the numbers and reach a different conclusion, or simply prefer to trust your own work, you can quickly build a custom view of White Mountains Insurance Group and shape a full story around your assumptions, then Do it your way.
A great starting point for your White Mountains Insurance Group research is our analysis highlighting 2 key rewards and 2 important warning signs that could impact your investment decision.
Looking for more investment ideas?
If White Mountains Insurance Group has sharpened your focus, do not stop here. Widening your search now could be the difference between spotting or missing your next opportunity.
- Target reliable compounding by scanning for income opportunities built around 16 dividend fortresses that aim to combine strong payouts with resilient business models.
- Hunt for value by checking companies that currently look attractively priced using our 55 high quality undervalued stocks, so you can focus quickly on names worth deeper research.
- Protect your downside by concentrating on resilient names through the 85 resilient stocks with low risk scores. This can help you keep potential shocks in check while you search for upside.
This article by Simply Wall St is general in nature. We provide commentary based on historical data and analyst forecasts only using an unbiased methodology and our articles are not intended to be financial advice. It does not constitute a recommendation to buy or sell any stock, and does not take account of your objectives, or your financial situation. We aim to bring you long-term focused analysis driven by fundamental data. Note that our analysis may not factor in the latest price-sensitive company announcements or qualitative material. Simply Wall St has no position in any stocks mentioned.
Have feedback on this article? Concerned about the content? Get in touch with us directly. Alternatively, email editorial-team@simplywallst.com