
- If you are wondering whether McGrath RentCorp at around US$110.67 is offering good value today, you are not alone. This article is built to help you weigh up what that price really represents.
- The stock is up 5.2% year to date. However, it has seen a 1.9% decline over the last week, a 5.7% decline over the last month and a 7.7% decline over the last year, which can change how the market is viewing its potential and risk.
- Recent coverage has focused on McGrath RentCorp's position in equipment and modular space rentals and how investors are reacting to broader sector sentiment, with attention on how stable cash generation and asset heavy models are being priced. This backdrop helps explain why the share price has moved around even without major company specific headlines dominating the story.
- On our checklist of 6 valuation tests, McGrath RentCorp scores 5 out of 6, as shown in our valuation score. Next, we will walk through key valuation approaches before finishing with a way to look beyond the numbers to understand what that score really means.
Find out why McGrath RentCorp's -7.7% return over the last year is lagging behind its peers.
Approach 1: McGrath RentCorp Discounted Cash Flow (DCF) Analysis
The Discounted Cash Flow model estimates what a business is worth today by projecting its future cash flows and discounting them back to a present value. It is essentially asking what those future dollars are worth in your hands right now.
For McGrath RentCorp, the model used is a 2 Stage Free Cash Flow to Equity approach, based on cash flow projections. The latest twelve month Free Cash Flow is about $89.2 million. Analysts have specific estimates out to 2027, including projected Free Cash Flow of $186.95 million in 2027. Simply Wall St then extends this with extrapolated projections through 2035.
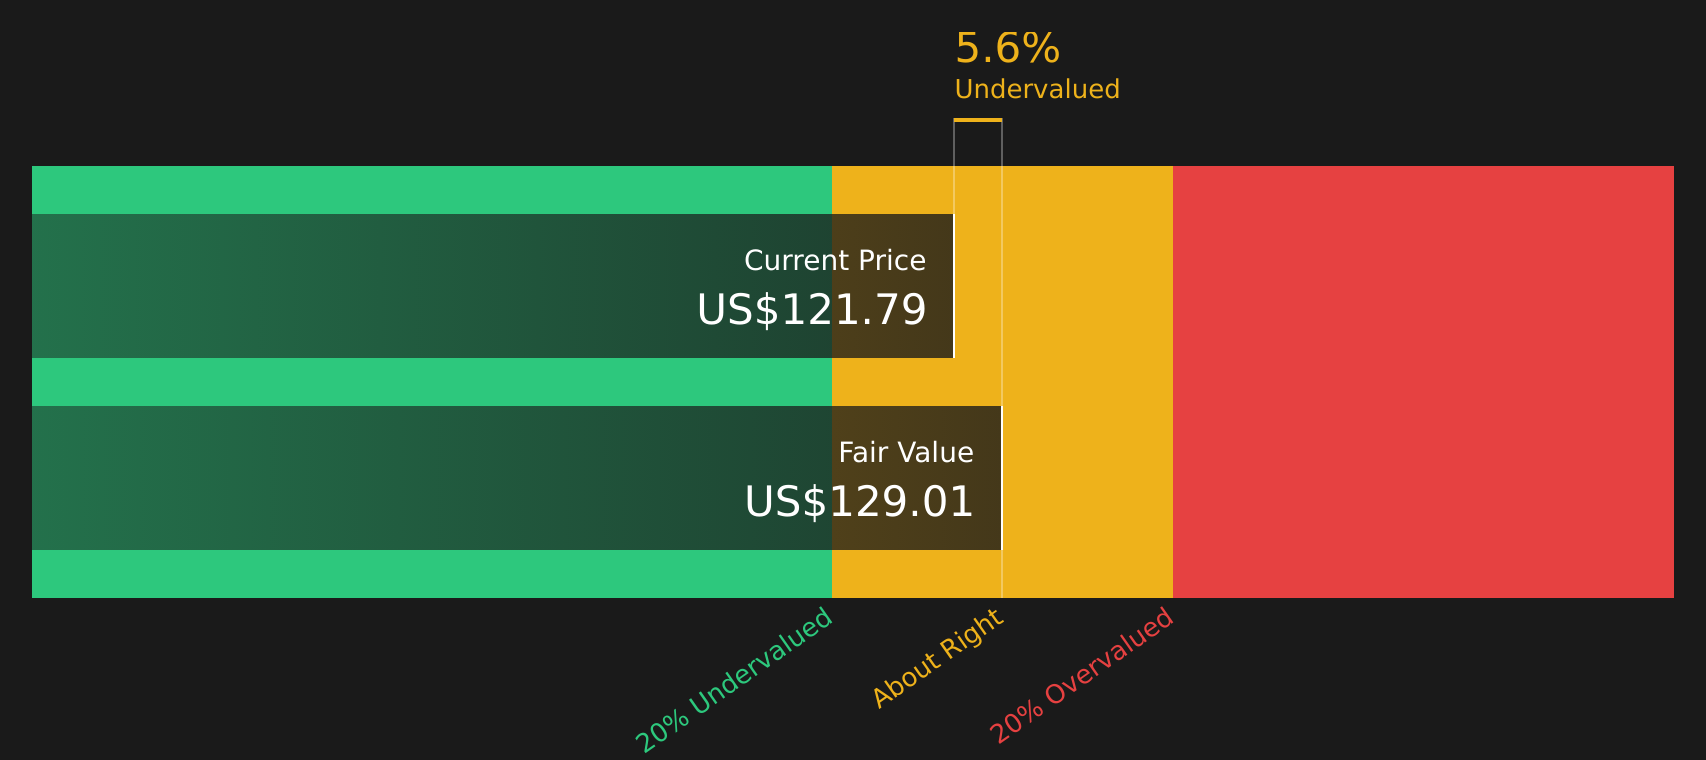
Adding up these discounted cash flows gives an estimated intrinsic value of about $111.89 per share. Compared to a current share price of around $110.67, the model suggests the stock is about 1.1% undervalued. This is a very small gap and within a reasonable margin of error for this kind of model.
Result: ABOUT RIGHT
McGrath RentCorp is fairly valued according to our Discounted Cash Flow (DCF), but this can change at a moment's notice. Track the value in your watchlist or portfolio and be alerted on when to act.
Approach 2: McGrath RentCorp Price vs Earnings
For a profitable company like McGrath RentCorp, the P/E ratio is a useful way to think about value because it links what you pay per share directly to the earnings the business is generating today.
In simple terms, higher growth expectations and lower perceived risk usually justify a higher P/E, while slower growth and higher risk are often associated with a lower, more conservative P/E. So what counts as "normal" depends on how the market views the company’s prospects and stability.
McGrath RentCorp currently trades on a P/E of 17.43x, compared with the Trade Distributors industry average of about 22.12x and a peer group average of 21.83x. Simply Wall St also calculates a “Fair Ratio” for the stock of 18.96x, which is the P/E level suggested by factors such as its earnings growth profile, profitability, industry, market cap and risk characteristics.
This Fair Ratio is more tailored than a simple peer or industry comparison because it accounts for company specific drivers rather than assuming all firms should trade at the same multiple. With the actual P/E of 17.43x sitting below the Fair Ratio of 18.96x, this framework points to McGrath RentCorp trading at a discount on an earnings basis.
Result: UNDERVALUED

P/E ratios tell one story, but what if the real opportunity lies elsewhere? Start investing in legacies, not executives. Discover our 19 top founder-led companies.
Upgrade Your Decision Making: Choose your McGrath RentCorp Narrative
Earlier we mentioned that there is an even better way to understand valuation. On Simply Wall St’s Community page you can use Narratives, which are simple stories that link your view of McGrath RentCorp’s business to a financial forecast and a fair value. You can then compare that fair value with the current price to help you judge whether you think it is time to buy or sell. The numbers update automatically when new earnings or news arrive. For example, one investor might use the analysts’ assumptions and a fair value of US$147 per share to argue that recurring rental revenues and investments in technology, operations and new markets support that number. Another investor might focus on softer demand, higher operating costs and exposure to commercial construction cycles to justify a lower fair value and a more cautious stance.
Do you think there's more to the story for McGrath RentCorp? Head over to our Community to see what others are saying!

This article by Simply Wall St is general in nature. We provide commentary based on historical data and analyst forecasts only using an unbiased methodology and our articles are not intended to be financial advice. It does not constitute a recommendation to buy or sell any stock, and does not take account of your objectives, or your financial situation. We aim to bring you long-term focused analysis driven by fundamental data. Note that our analysis may not factor in the latest price-sensitive company announcements or qualitative material. Simply Wall St has no position in any stocks mentioned.
Have feedback on this article? Concerned about the content? Get in touch with us directly. Alternatively, email editorial-team@simplywallst.com