
- If you are wondering whether Pool at around US$222 still lines up with what it might be worth, you are not alone and this article is set up to help you frame that question clearly.
- The share price has moved 1.6% over the last 7 days, while returns sit at a 12.6% decline over 30 days, a 3.4% decline year to date, and declines of 34.4% over 1 year, 35.2% over 3 years and 28.3% over 5 years, which will affect how many investors view its growth potential and risk.
- Recent coverage around Pool has been more about maintaining evergreen interest in the company than about any single headline event. That is why you are seeing this fresh look at the stock now. That context makes it a useful moment to step back from short term moves and look at what the business might reasonably be worth.
- On our checks, Pool has a valuation score of 3 out of 6. Next we will walk through what that means across different valuation methods before finishing with a way to think about value that goes beyond the usual models.
Find out why Pool's -34.4% return over the last year is lagging behind its peers.
Approach 1: Pool Discounted Cash Flow (DCF) Analysis
A Discounted Cash Flow, or DCF, model estimates what a business could be worth by projecting its future cash flows and then discounting those back to today to reflect risk and the time value of money.
For Pool, the model used is a 2 Stage Free Cash Flow to Equity approach built on cash flow projections. The latest twelve month Free Cash Flow is about $308.2 million. Analyst forecasts and subsequent extrapolations point to Free Cash Flow of $389.8 million in 2026 and $454.5 million in 2028, reaching about $644.9 million by 2035, all in $ terms. Simply Wall St discounts these projected cash flows back to today to estimate what the equity might be worth now.
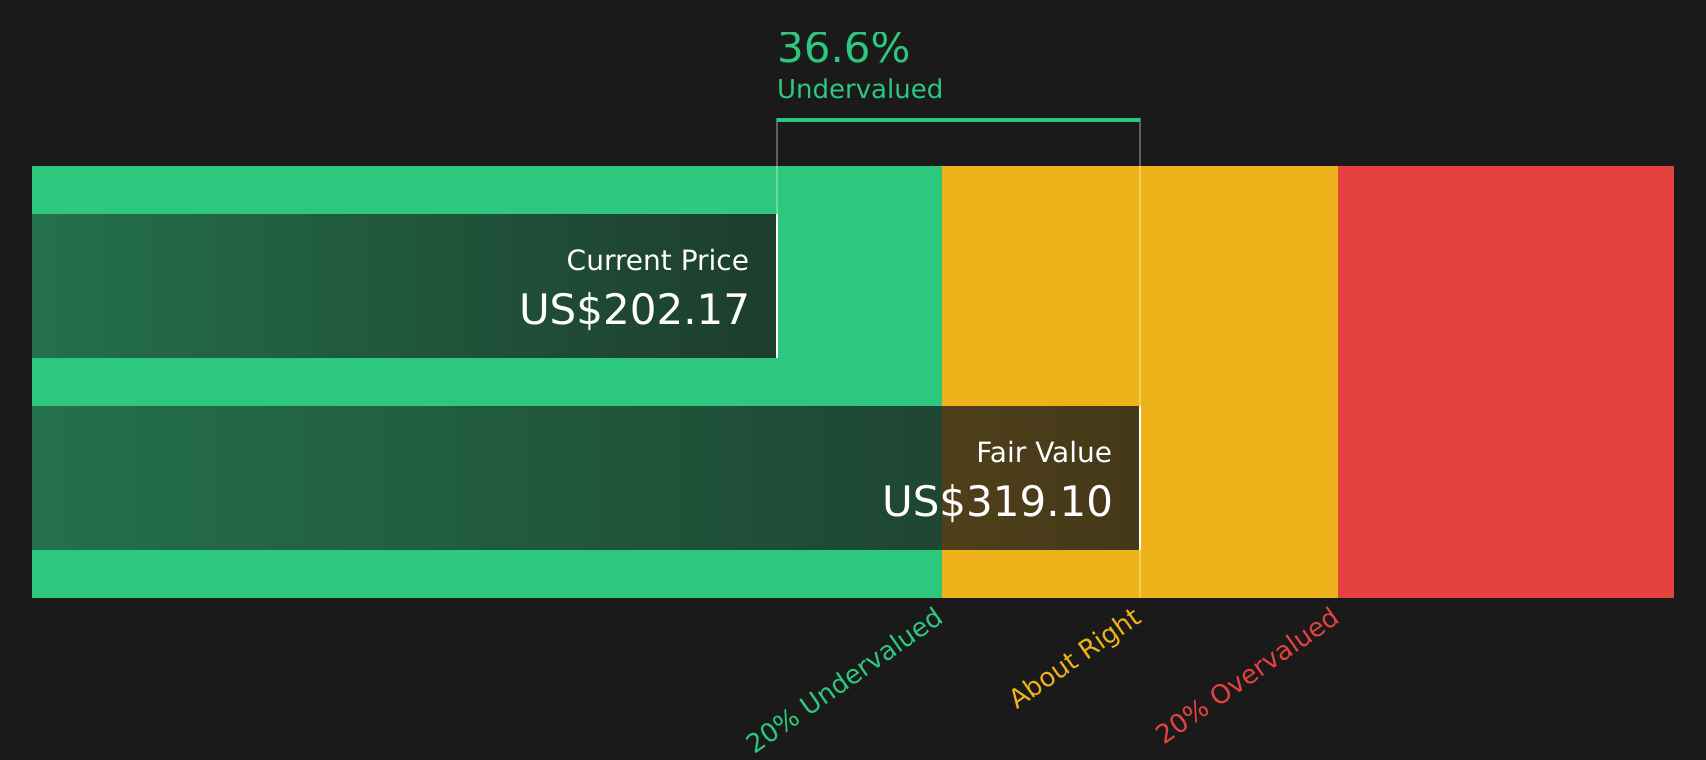
On this basis, the DCF model produces an estimated intrinsic value of about $318.84 per share. Compared with the recent share price around $222, the DCF output suggests Pool is trading at roughly a 30.4% discount. This points to the shares looking materially undervalued on this measure.
Result: UNDERVALUED
Our Discounted Cash Flow (DCF) analysis suggests Pool is undervalued by 30.4%. Track this in your watchlist or portfolio, or discover 45 more high quality undervalued stocks.
Approach 2: Pool Price vs Earnings (P/E)
For a profitable company like Pool, the P/E ratio is a useful way to relate what you pay for each share to the earnings that business is currently generating. It is a quick sense check on how the market is weighing those earnings against other opportunities.
What counts as a “normal” or “fair” P/E depends heavily on what investors expect for future growth and how risky they think those earnings are. Higher expected growth or lower perceived risk can support a higher P/E, while slower expected growth or higher risk usually lines up with a lower multiple.
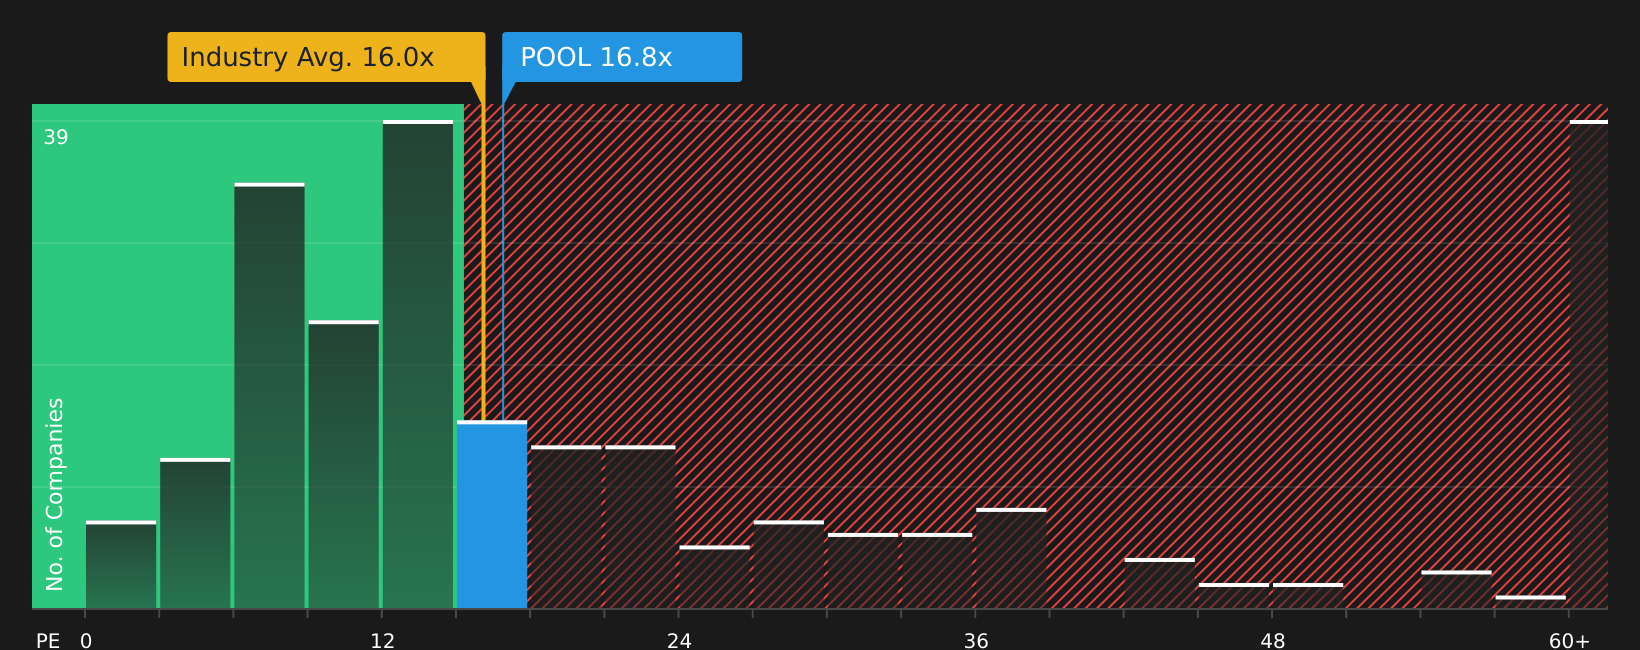
Pool currently trades on a P/E of 20.19x, compared with the Retail Distributors industry average of 15.81x and a peer group average of 41.50x. Simply Wall St also calculates a proprietary Fair Ratio of 15.11x for Pool, which is the P/E level it might typically trade at given factors such as its earnings growth profile, industry, profit margins, market value and risk characteristics.
This Fair Ratio can be more informative than a simple industry or peer comparison. It adjusts for Pool’s specific mix of growth, risk, profitability, sector and size. With the current P/E of 20.19x sitting above the Fair Ratio of 15.11x, the shares appear expensive on this metric.
Result: OVERVALUED
P/E ratios tell one story, but what if the real opportunity lies elsewhere? Start investing in legacies, not executives. Discover our 19 top founder-led companies.
Upgrade Your Decision Making: Choose your Pool Narrative
Earlier we mentioned that there is an even better way to understand valuation, so on Simply Wall St you can use Narratives. Here you describe your story for Pool in the Community page and link it to your own forecasts for revenue, earnings, margins and fair value. You can then compare that fair value to the current price, with the system updating your view as new news or earnings arrive. For example, one investor might lean toward the more bullish US$375 view, while another anchors closer to the US$229 bearish case. Each Narrative clearly shows how that different story leads to a different fair value and decision framework.
Do you think there's more to the story for Pool? Head over to our Community to see what others are saying!

This article by Simply Wall St is general in nature. We provide commentary based on historical data and analyst forecasts only using an unbiased methodology and our articles are not intended to be financial advice. It does not constitute a recommendation to buy or sell any stock, and does not take account of your objectives, or your financial situation. We aim to bring you long-term focused analysis driven by fundamental data. Note that our analysis may not factor in the latest price-sensitive company announcements or qualitative material. Simply Wall St has no position in any stocks mentioned.
Have feedback on this article? Concerned about the content? Get in touch with us directly. Alternatively, email editorial-team@simplywallst.com