
- If you are looking at American International Group and wondering whether the current share price lines up with its underlying value, this article is designed to walk you through that question clearly.
- The stock last closed at US$78.72, with returns of 2.2% decline over 7 days, 3.1% over 30 days, 6.6% decline year to date, 1.4% decline over 1 year, 58.3% over 3 years, and 82.1% over 5 years, which may catch the eye of investors thinking about both recent setbacks and longer term gains.
- Recent coverage around American International Group has focused on its position as a large insurer and financial services provider, with investors closely watching how the company manages risk, capital allocation, and its portfolio mix. Together with sector wide discussions about insurance pricing and claims trends, this context helps frame how the market currently prices the shares.
- On our valuation framework, American International Group scores 3 out of 6 on our value checks, which you can see in full through our valuation score. Next we will compare methods like P/E, P/B, and cash flow based models, before finishing with a more holistic way to think about what the market might be missing.
Approach 1: American International Group Excess Returns Analysis
The Excess Returns model looks at how effectively a company is expected to earn above its cost of equity on the capital invested in its business, then converts those excess profits into an estimate of value per share.
For American International Group, the starting point is an estimated Book Value of $76.44 per share and a Stable EPS of $9.08 per share, based on weighted future Return on Equity estimates from 7 analysts. The Average Return on Equity is 10.36%, while the Cost of Equity is estimated at $6.12 per share. That gap produces an Excess Return of $2.96 per share, which is what the model treats as value created beyond the required return for shareholders.
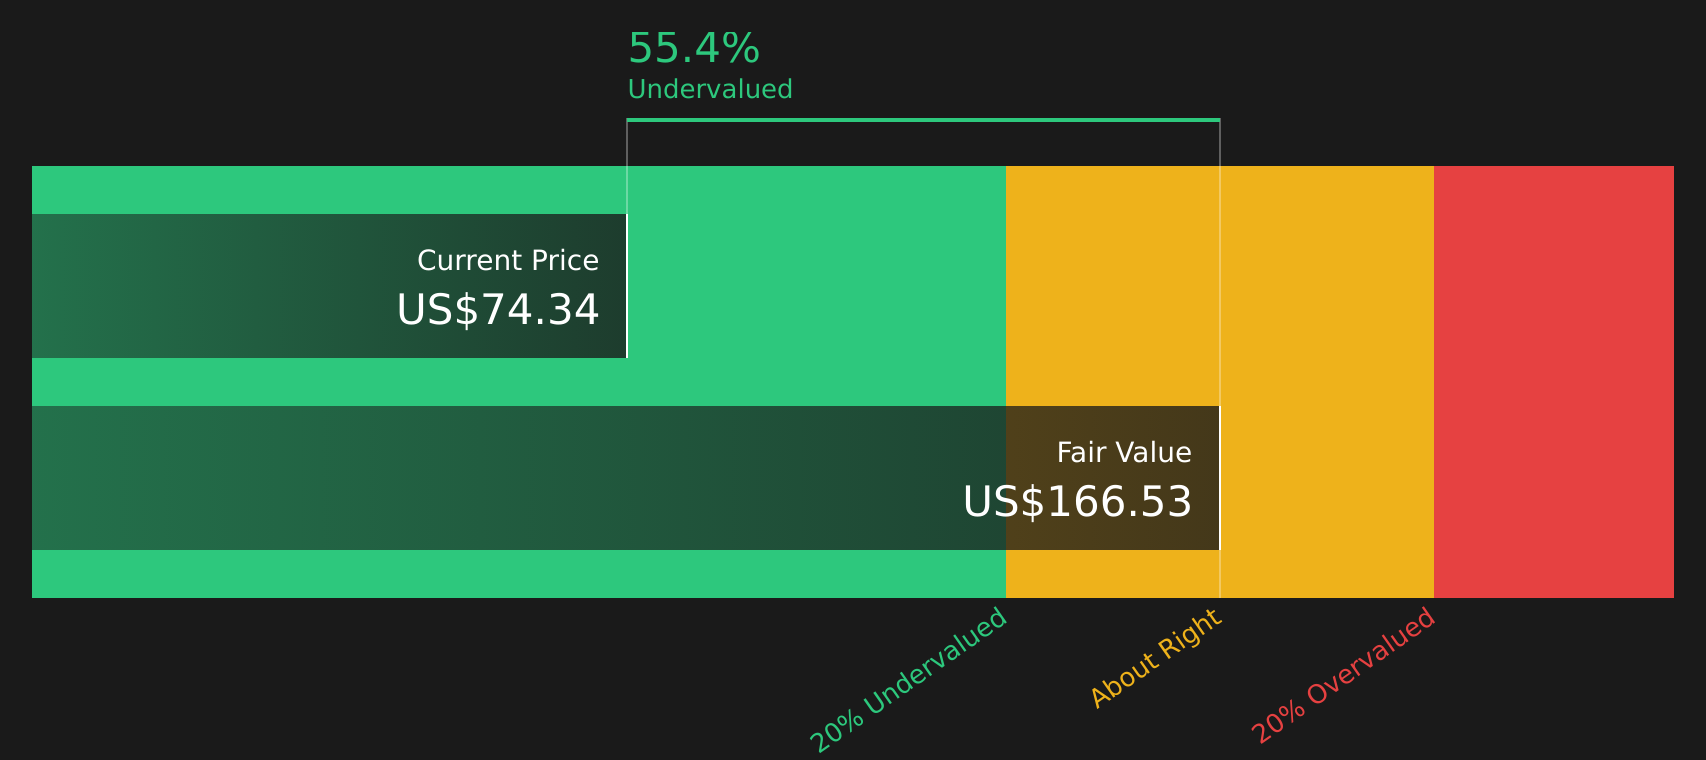
The Stable Book Value is projected at $87.69 per share, based on weighted future Book Value estimates from 10 analysts. Combining these inputs, the Excess Returns model arrives at an intrinsic value of about $170.78 per share, which implies the stock is 53.9% undervalued compared with the recent price of US$78.72.
Result: UNDERVALUED
Our Excess Returns analysis suggests American International Group is undervalued by 53.9%. Track this in your watchlist or portfolio, or discover 50 more high quality undervalued stocks.
Approach 2: American International Group Price vs Earnings
For a profitable company like American International Group, the P/E ratio is a straightforward way to relate what you pay for the stock to the earnings it currently generates. It gives you a quick sense of how much the market is willing to pay for each dollar of profit.
What counts as a “normal” or “fair” P/E will usually reflect how the market sees a company’s growth prospects and risk. Higher expected growth or lower perceived risk can support a higher P/E, while slower growth or higher uncertainty can pull it down.
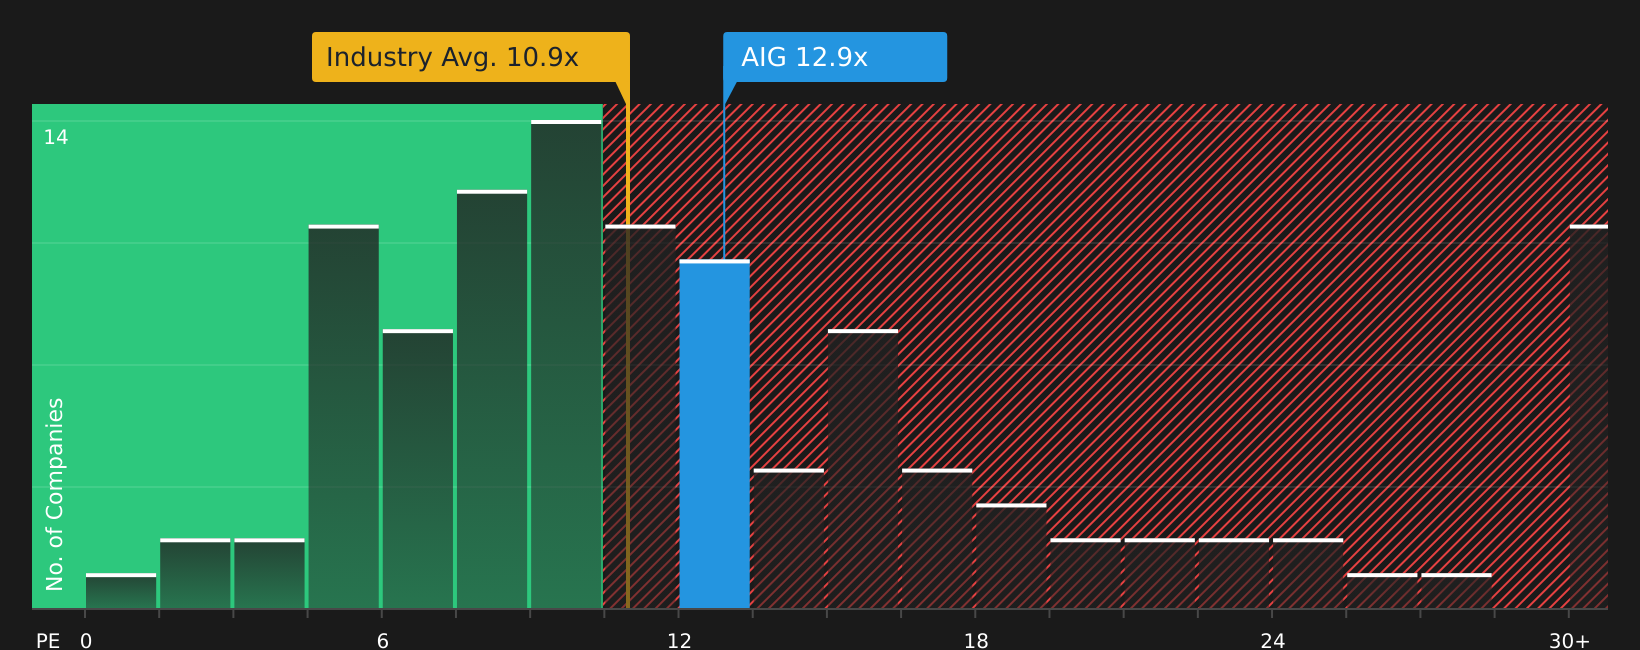
American International Group currently trades on a P/E of 13.64x. That sits above the Insurance industry average of 11.85x and the peer average of 9.44x. Simply Wall St’s Fair Ratio for American International Group is 15.97x, which is a proprietary estimate of the P/E that might be appropriate after considering factors such as earnings growth, profit margins, industry, market cap and company specific risks. This Fair Ratio can be more informative than a simple peer or industry comparison because it adjusts for these company characteristics rather than treating all insurers as identical. With the current P/E of 13.64x below the Fair Ratio of 15.97x, the shares appear undervalued on this metric.
Result: UNDERVALUED
P/E ratios tell one story, but what if the real opportunity lies elsewhere? Start investing in legacies, not executives. Discover our 20 top founder-led companies.
Upgrade Your Decision Making: Choose your American International Group Narrative
Earlier we mentioned that there is an even better way to understand valuation, so let us introduce you to Narratives. These are simple stories you create about American International Group that connect your view of its future revenue, earnings and margins to a financial forecast, a fair value and a clear comparison with today’s price. All of this sits within the Narratives tool on Simply Wall St’s Community page, which is used by millions of investors. Each Narrative updates automatically when new news, earnings or analyst targets arrive. For example, one American International Group Narrative might lean toward the higher analyst price target of US$96.00 with stronger margin assumptions, while another might sit closer to the lower US$79.00 target with more cautious views on insurance pricing and risks. This gives you a structured way to see how different stories about the same company can lead to different fair values and different views on whether the current price of about US$78.48 looks attractive for your own approach.
Do you think there's more to the story for American International Group? Head over to our Community to see what others are saying!

This article by Simply Wall St is general in nature. We provide commentary based on historical data and analyst forecasts only using an unbiased methodology and our articles are not intended to be financial advice. It does not constitute a recommendation to buy or sell any stock, and does not take account of your objectives, or your financial situation. We aim to bring you long-term focused analysis driven by fundamental data. Note that our analysis may not factor in the latest price-sensitive company announcements or qualitative material. Simply Wall St has no position in any stocks mentioned.
Have feedback on this article? Concerned about the content? Get in touch with us directly. Alternatively, email editorial-team@simplywallst.com