
- If you are wondering whether Travelers Companies at around US$306 per share still offers reasonable value, you are not alone. This article is designed to help you weigh what the current price might be implying.
- The stock has been relatively steady in the very short term with a 0.8% decline over the last 7 days, while the 30 day, year to date and 1 year returns of 3.8%, 7.4% and 20.8% give a fuller picture of how the market has been pricing it recently.
- Alongside these moves, investors have been reacting to ongoing sector wide conversations about pricing, underwriting discipline and capital allocation across large US insurers, which all feed into how a company like Travelers is valued. Broader insurance industry news around interest rates, catastrophe exposure and regulatory focus has also shaped sentiment and helps explain why the stock’s longer term returns over 3 and 5 years, at 83.6% and 114.2%, look different to the very recent weekly move.
- On our simple valuation checks, Travelers scores 3 out of 6. In the next sections we will compare different valuation approaches to see what that could mean for you, before finishing with a framework that can help you interpret these numbers in an even more useful way.
Approach 1: Travelers Companies Excess Returns Analysis
The Excess Returns model looks at how much profit a company is expected to earn on its equity above the return that shareholders require, then sums those gains into a per share value today.
For Travelers Companies, the starting point is an estimated Book Value of $151.24 per share and a Stable EPS of $29.71 per share, based on weighted future Return on Equity estimates from 14 analysts. The Average Return on Equity used in the model is 16.22%, compared with a Cost of Equity of $12.78 per share. That gap leads to an estimated Excess Return of $16.93 per share.
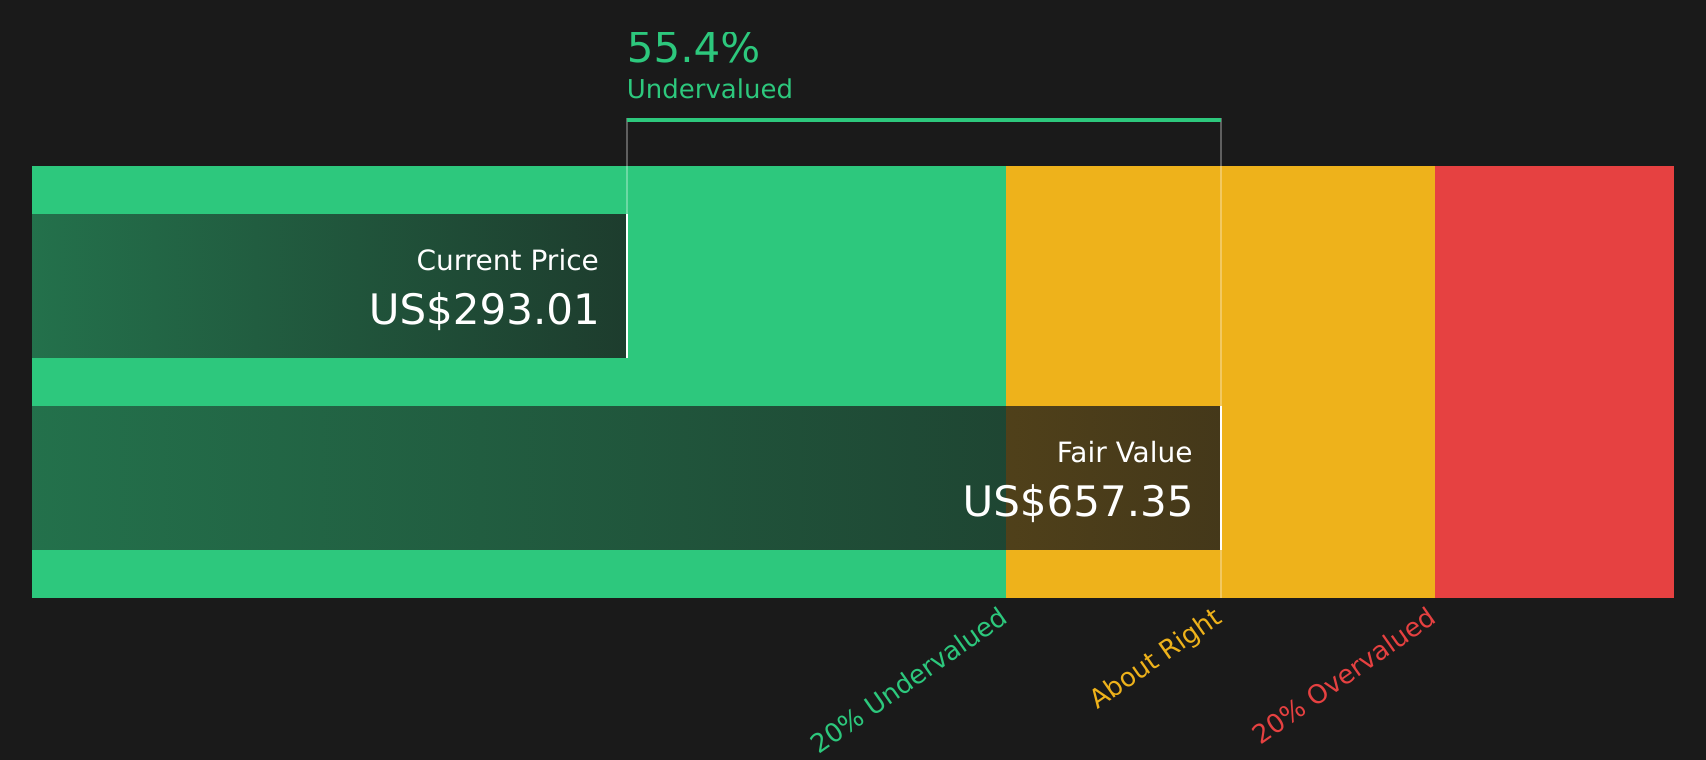
The model also incorporates a Stable Book Value per share of $183.11, again sourced from weighted future Book Value estimates from 14 analysts. Putting these inputs together, the Excess Returns valuation arrives at an intrinsic value of about $657.56 per share. Against a current share price around $306, this suggests the stock is trading at a discount of approximately 53.4% on this framework.
Result: UNDERVALUED
Our Excess Returns analysis suggests Travelers Companies is undervalued by 53.4%. Track this in your watchlist or portfolio, or discover 50 more high quality undervalued stocks.
Approach 2: Travelers Companies Price vs Earnings
For a profitable insurer like Travelers Companies, the P/E ratio is a useful way to connect the share price with the earnings that support it, which is usually what drives long term returns. What counts as a “normal” or “fair” P/E depends on how the market views a company’s earnings growth prospects and risk profile, with higher expected growth or lower perceived risk often linked to higher P/E levels.
Travelers currently trades on a P/E of 10.61x. That sits below the broader Insurance industry average P/E of 11.61x and modestly above the peer group average of 9.70x. Simply Wall St’s Fair Ratio for Travelers is 10.57x, which is its proprietary estimate of what a reasonable P/E could be given factors like the company’s earnings growth profile, margins, size and risk characteristics. This Fair Ratio can be more tailored than a simple comparison with peers or the industry, because it tries to adjust for differences in fundamentals rather than assuming all insurers should trade at similar multiples.
With the Fair Ratio at 10.57x and the actual P/E at 10.61x, the stock looks priced at about the level this framework would suggest.
Result: ABOUT RIGHT

P/E ratios tell one story, but what if the real opportunity lies elsewhere? Start investing in legacies, not executives. Discover our 20 top founder-led companies.
Upgrade Your Decision Making: Choose your Travelers Companies Narrative
Earlier we mentioned that there is an even better way to understand valuation, so let us introduce you to Narratives, where you spell out your story for Travelers Companies, link that story to a forecast for revenue, earnings and margins, and then see what fair value that implies.
On Simply Wall St’s Community page, Narratives let you plug in your own expectations in a simple, guided format, then compare the fair value that follows from your assumptions with the current share price. This can help you decide whether you view the stock as attractive, fully valued or expensive at today’s level.
Narratives on the platform refresh as new information arrives, such as earnings, product launches like Travelers’ AI Claim Assistant and TravAI, or changes in analyst estimates. This means your fair value view can stay aligned with the latest data without you rebuilding your whole model.
For example, one investor might build a Travelers Narrative close to the current analyst fair value around US$302 per share. Another investor, who is more optimistic about underwriting discipline and AI driven efficiency, might anchor closer to the high analyst price target of US$320. A more cautious investor could lean toward the low end near US$233. This illustrates how the same company can support very different stories and fair values.
Do you think there's more to the story for Travelers Companies? Head over to our Community to see what others are saying!

This article by Simply Wall St is general in nature. We provide commentary based on historical data and analyst forecasts only using an unbiased methodology and our articles are not intended to be financial advice. It does not constitute a recommendation to buy or sell any stock, and does not take account of your objectives, or your financial situation. We aim to bring you long-term focused analysis driven by fundamental data. Note that our analysis may not factor in the latest price-sensitive company announcements or qualitative material. Simply Wall St has no position in any stocks mentioned.
Have feedback on this article? Concerned about the content? Get in touch with us directly. Alternatively, email editorial-team@simplywallst.com