
- If you are wondering whether Pool's current share price lines up with its underlying worth, you are not alone. This article is built to help you size up what you are really paying for.
- Pool's stock recently closed at US$210.88, with returns of a 4.3% decline over 7 days, a 19.7% decline over 30 days, an 8.2% decline year to date, a 35.5% decline over 1 year, a 36.3% decline over 3 years, and a 33.8% decline over 5 years, which may have shifted how investors think about its risk and potential.
- Recent coverage around Pool has focused on its position as a major pool supplies distributor and how sentiment around housing related spending and discretionary home improvement is influencing interest in the stock. This backdrop gives important context for understanding why the share price has moved and what investors might be pricing in.
- On our valuation checks, Pool scores a 4 out of 6 value score. Next, we will look at what different valuation methods say about that number, before finishing with a more complete way to think about what the stock could be worth.
Find out why Pool's -35.5% return over the last year is lagging behind its peers.
Approach 1: Pool Discounted Cash Flow (DCF) Analysis
A Discounted Cash Flow, or DCF, model projects a company’s future cash flows and then discounts them back to today’s dollars to estimate what the entire business might be worth right now.
For Pool, the model used is a 2 Stage Free Cash Flow to Equity approach, built on cash flow projections. The latest twelve month free cash flow is about $308.2 million. Analysts have supplied specific forecasts out to 2028, with Simply Wall St extrapolating further, so projected free cash flow in 2035 is $644.9 million, all in $.
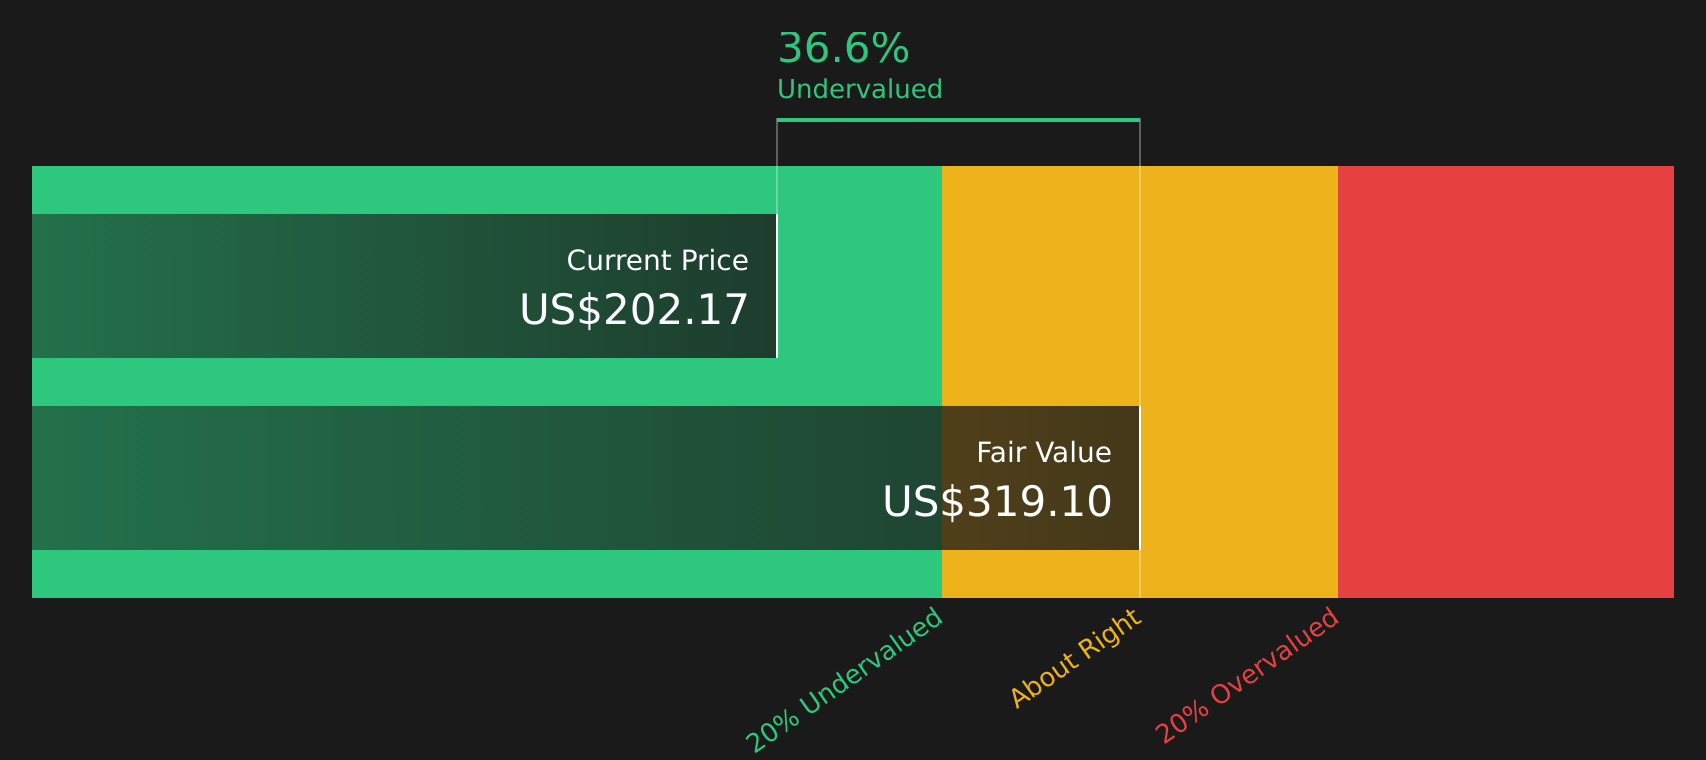
When these projected cash flows are discounted back to today, the DCF model arrives at an estimated intrinsic value of about $320.52 per share, compared with a recent share price of $210.88. That gap implies a 34.2% discount, which suggests the shares screen as undervalued on this model.
Result: UNDERVALUED
Our Discounted Cash Flow (DCF) analysis suggests Pool is undervalued by 34.2%. Track this in your watchlist or portfolio, or discover 50 more high quality undervalued stocks.
Approach 2: Pool Price vs Earnings
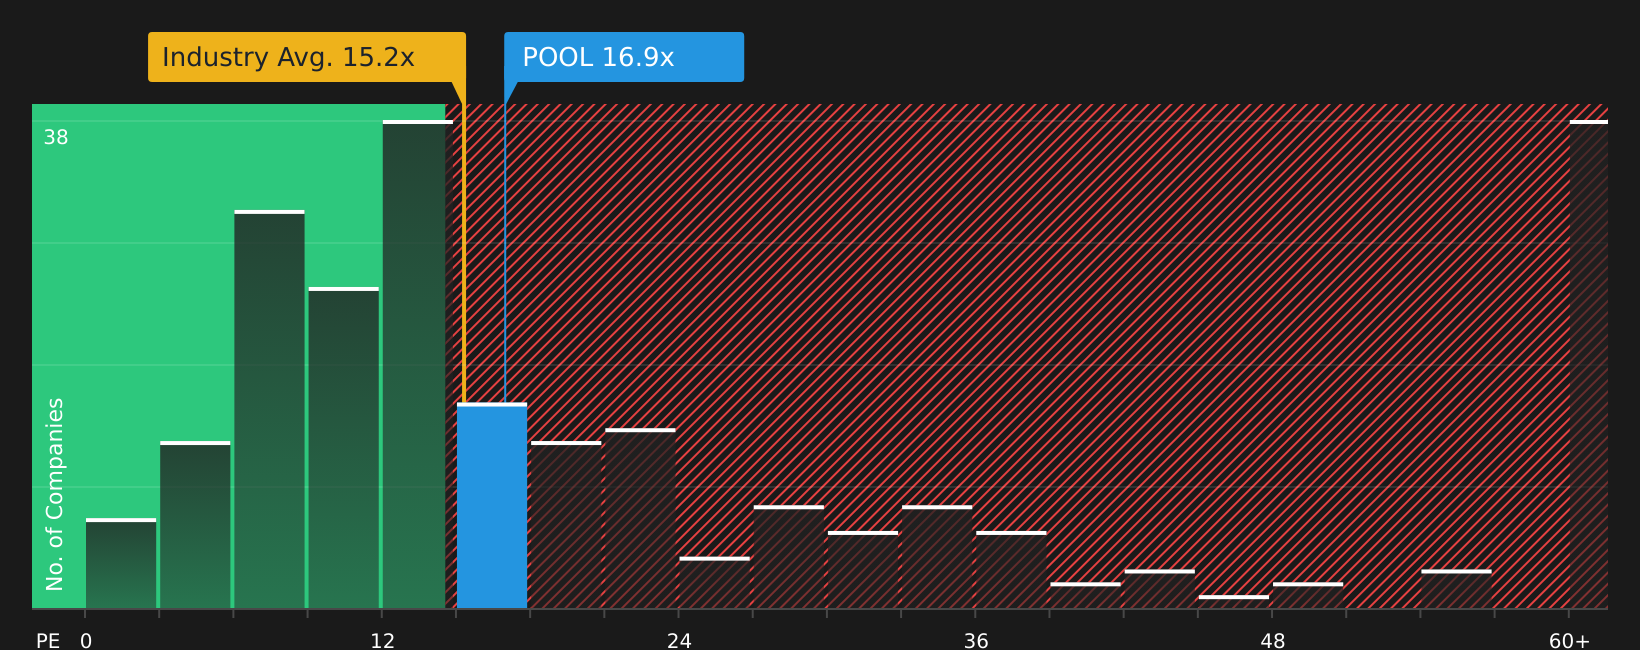
For a profitable company like Pool, the P/E ratio is a helpful way to see what you are paying for each dollar of current earnings. A higher or lower P/E often reflects what the market is factoring in around growth prospects and risk, so there is no single "right" number, just a range that tends to make sense for a given business.
Pool currently trades on a P/E of 19.18x. That sits above the Retail Distributors industry average P/E of 15.36x, while the peer group in this analysis sits at a P/E of 38.71x. To go a step further, Simply Wall St calculates a proprietary "Fair Ratio" for Pool of 14.92x, which is the P/E level that would typically fit its mix of earnings growth profile, margins, size and risk characteristics.
This Fair Ratio is often more useful than a simple comparison with industry or peers, because it adjusts for the specifics of Pool rather than assuming all companies deserve similar valuation multiples. Comparing Pool’s current P/E of 19.18x with the Fair Ratio of 14.92x suggests the shares screen as overvalued on this metric.
Result: OVERVALUED
P/E ratios tell one story, but what if the real opportunity lies elsewhere? Start investing in legacies, not executives. Discover our 20 top founder-led companies.
Upgrade Your Decision Making: Choose your Pool Narrative
Earlier we mentioned that there is an even better way to understand valuation. Narratives on Simply Wall St let you attach your story about Pool to the numbers by linking what you believe about its future revenue, earnings and margins to a financial forecast, a Fair Value, and then a clear comparison with the current price. All of this is available in an accessible tool on the Community page that automatically refreshes when new news or earnings arrive. One investor might build a Pool Narrative around more optimistic assumptions that support a Fair Value near US$334.00, while another might lean on a more cautious case closer to US$229.00. Seeing those side by side can help you decide whether Pool looks closer to a buy, a sell, or a hold for your own portfolio.
Do you think there's more to the story for Pool? Head over to our Community to see what others are saying!

This article by Simply Wall St is general in nature. We provide commentary based on historical data and analyst forecasts only using an unbiased methodology and our articles are not intended to be financial advice. It does not constitute a recommendation to buy or sell any stock, and does not take account of your objectives, or your financial situation. We aim to bring you long-term focused analysis driven by fundamental data. Note that our analysis may not factor in the latest price-sensitive company announcements or qualitative material. Simply Wall St has no position in any stocks mentioned.
Have feedback on this article? Concerned about the content? Get in touch with us directly. Alternatively, email editorial-team@simplywallst.com