
- If you are wondering whether TransUnion's current share price around US$71.58 offers value, the key is understanding what the market is really pricing in.
- The stock has returned 1.2% over the last 7 days but is down 6.1% over 30 days, 14.1% year to date and 18.0% over the past year, which can change how investors think about both upside potential and risk.
- Over the last few years, TransUnion has also posted a 24.8% return across 3 years while the 5 year return stands at a 19.0% decline, giving a mixed picture of how the market has treated the shares across different time frames. This blend of shorter term and longer term moves is the backdrop for any fresh look at what the stock might be worth today.
- Simply Wall St currently gives TransUnion a valuation score of 4/6, and the rest of this article will walk through the main valuation approaches behind that score, before finishing with a framework that can help you interpret those numbers in a more complete way.
Approach 1: TransUnion Discounted Cash Flow (DCF) Analysis
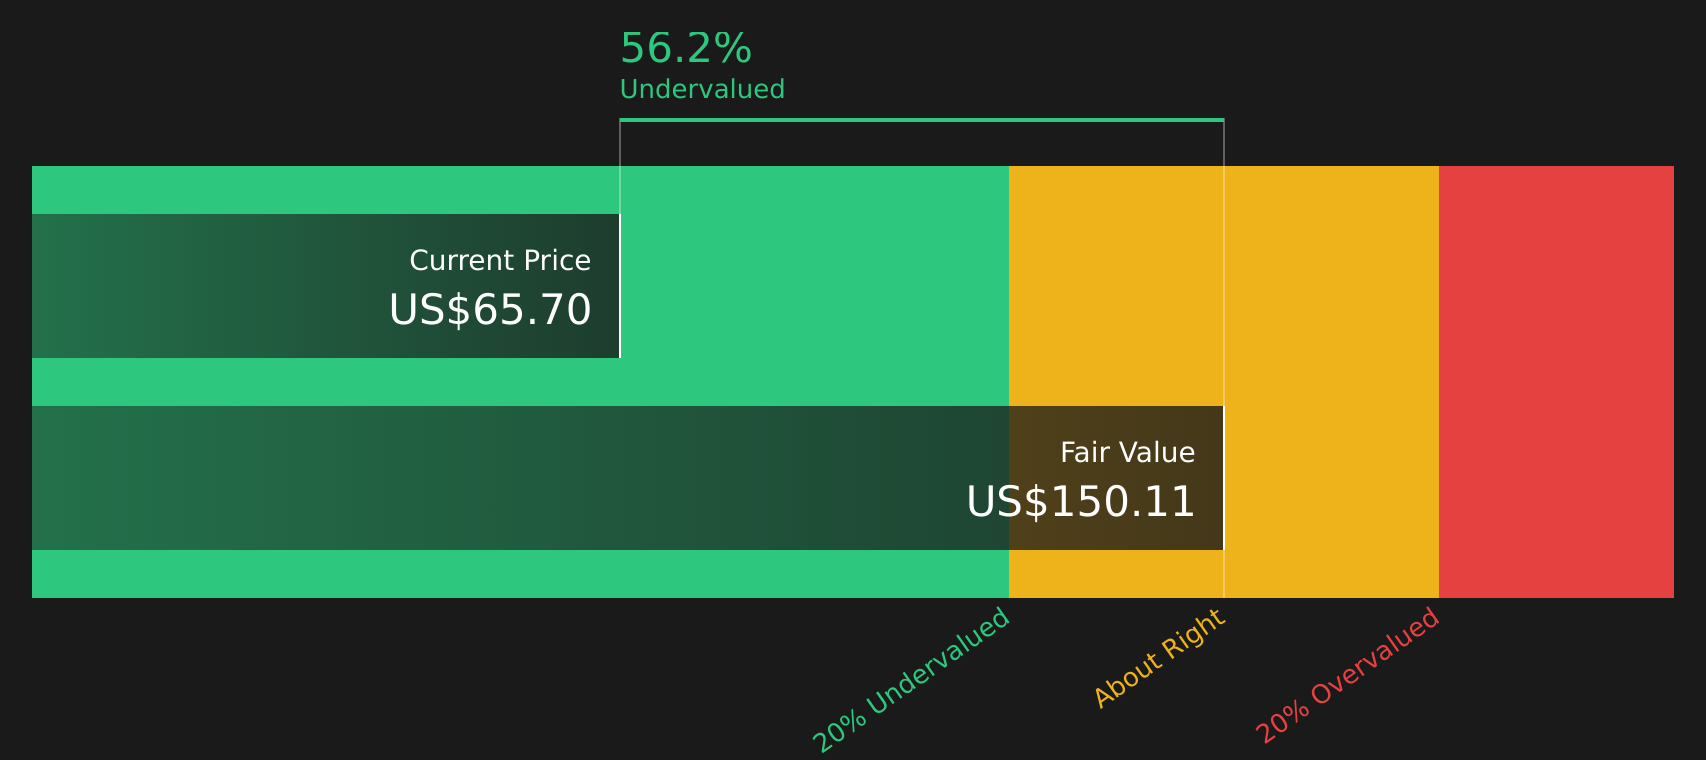
A Discounted Cash Flow, or DCF, model takes estimates of the cash a business may generate in the future and discounts those cash flows back to today to arrive at an estimated intrinsic value per share.
For TransUnion, the model used is a 2 Stage Free Cash Flow to Equity approach based on cash flow projections. The latest twelve months Free Cash Flow is about $641.4 million. Analysts provide detailed projections out to 2030, with Simply Wall St extending the profile further using its own assumptions. For example, projected Free Cash Flow for 2030 is $1,446 million, with interim years such as 2026 and 2027 estimated at $882.97 million and $1,069.6 million respectively, all in $ and then discounted back to today.
On this basis, the DCF model arrives at an estimated intrinsic value of about $150.75 per share. Compared with the current share price around $71.58, this implies the stock is 52.5% undervalued according to these cash flow projections and discounting assumptions.
Result: UNDERVALUED
Our Discounted Cash Flow (DCF) analysis suggests TransUnion is undervalued by 52.5%. Track this in your watchlist or portfolio, or discover 55 more high quality undervalued stocks.
Approach 2: TransUnion Price vs Earnings
For a profitable company like TransUnion, the P/E ratio is a useful way to think about what you are paying for each dollar of earnings. It links directly to the business you own, because it compares the share price with actual earnings rather than sales or assets.
What counts as a "fair" P/E usually reflects how the market views the company’s growth prospects and risk. Higher expected growth or lower perceived risk can justify a higher P/E, while lower growth or higher risk can align with a lower multiple.
TransUnion currently trades on a P/E of 30.27x, compared with the Professional Services industry average of 19.04x and a peer average of 26.01x. Simply Wall St’s proprietary Fair Ratio for TransUnion is 32.37x. This Fair Ratio is designed to be more tailored than a simple comparison with peers or the industry, because it factors in elements such as earnings growth, profit margins, market cap, industry, and company specific risks.
Since the current P/E of 30.27x is below the Fair Ratio of 32.37x, the shares screen as undervalued on this metric.
Result: UNDERVALUED

P/E ratios tell one story, but what if the real opportunity lies elsewhere? Start investing in legacies, not executives. Discover our 20 top founder-led companies.
Upgrade Your Decision Making: Choose your TransUnion Narrative
Earlier it was mentioned that there is an even better way to understand valuation. Narratives let you attach a clear story to your TransUnion numbers by linking your view on its business, such as AI credit analytics, rental data and global expansion, to a concrete forecast for revenue, earnings and margins. This then flows through to a Fair Value you can compare directly with the current price, all within Simply Wall St's Community page where Narratives update as news or earnings arrive. For example, a more optimistic TransUnion view might align with a Fair Value around US$94.60, while a more cautious view might line up closer to US$78.00, giving you a structured way to decide how your own outlook fits between the highest analyst target of US$135.00 and the lowest of US$78.00.
Do you think there's more to the story for TransUnion? Head over to our Community to see what others are saying!

This article by Simply Wall St is general in nature. We provide commentary based on historical data and analyst forecasts only using an unbiased methodology and our articles are not intended to be financial advice. It does not constitute a recommendation to buy or sell any stock, and does not take account of your objectives, or your financial situation. We aim to bring you long-term focused analysis driven by fundamental data. Note that our analysis may not factor in the latest price-sensitive company announcements or qualitative material. Simply Wall St has no position in any stocks mentioned.
Have feedback on this article? Concerned about the content? Get in touch with us directly. Alternatively, email editorial-team@simplywallst.com