
- If you are wondering whether Sempra at around US$93.46 is offering value or asking too much, especially after a strong run, this breakdown will help you judge whether the current price matches what you are getting.
- The share price sits at US$93.46 after a 2.6% decline over the last 7 days, a flat 0.1% move over 30 days, and gains of 4.2% year to date, 37.1% over 1 year, 42.4% over 3 years, and 65.6% over 5 years.
- Recent moves in the stock have drawn extra attention to how Sempra is valued, with investors weighing its track record against what the current price implies. That focus on valuation makes it useful to compare different methods side by side rather than relying on a single metric.
- Right now, Sempra has a valuation score of 0 out of 6, so the company is not flagged as undervalued on any of the six checks. The sections ahead will walk through these valuation approaches, and will also keep an eye on an additional way to think about value at the end of the article.
Sempra scores just 0/6 on our valuation checks. See what other red flags we found in the full valuation breakdown.
Approach 1: Sempra Discounted Cash Flow (DCF) Analysis
A Discounted Cash Flow, or DCF, model estimates what a company might be worth today by projecting its future cash flows and then discounting those back to the present using a required rate of return.
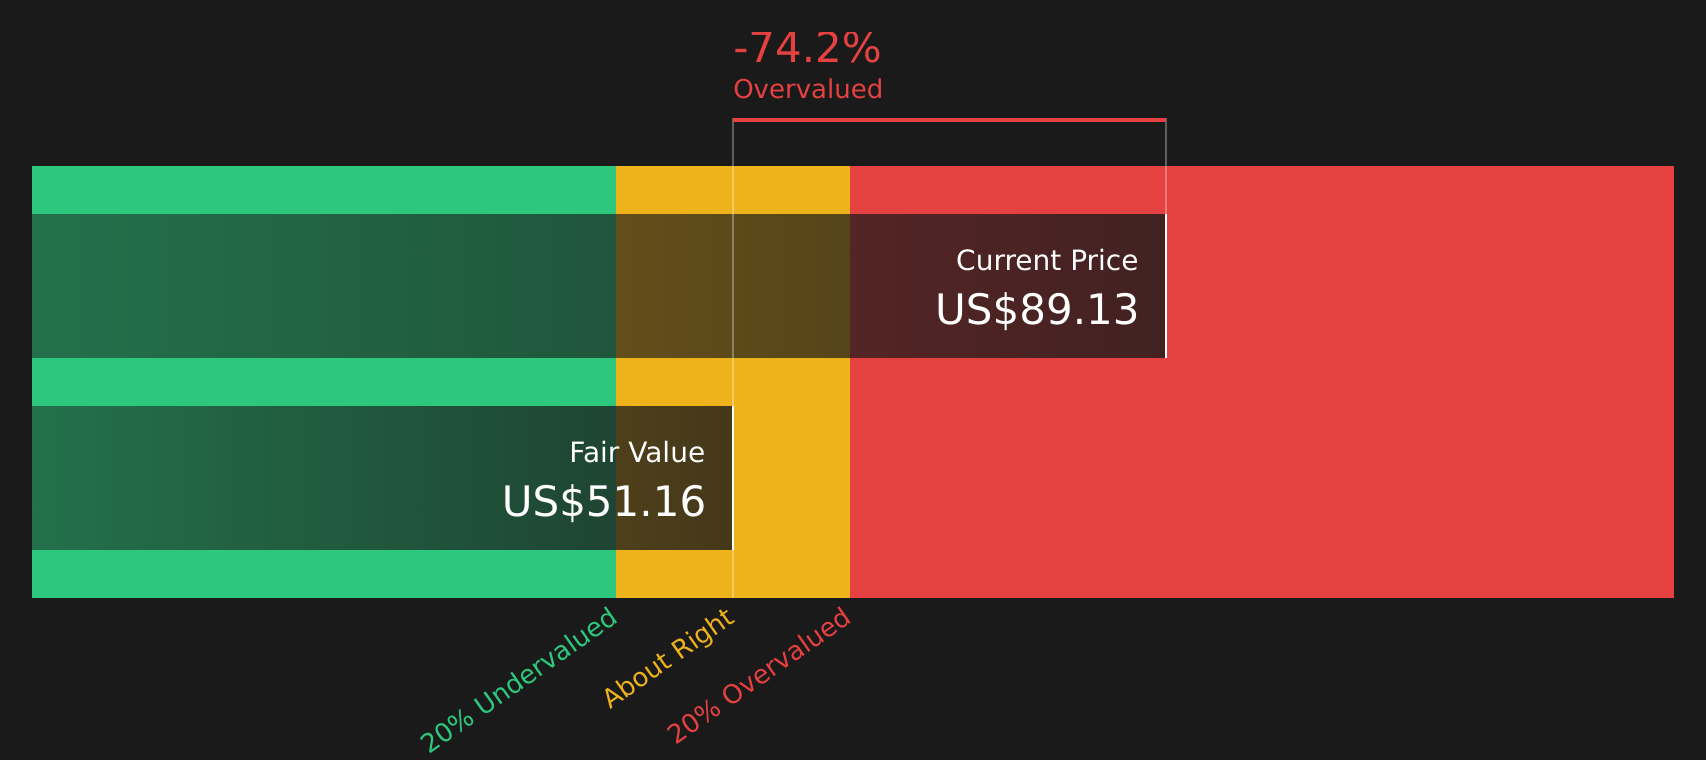
For Sempra, the model used is a 2 Stage Free Cash Flow to Equity approach, which looks at free cash flow available to shareholders. The latest twelve month free cash flow stands at a loss of about US$3.99b. Analysts provide explicit projections for the next few years, and Simply Wall St then extrapolates further, including an estimated free cash flow of US$1.72b in 2028 and smaller amounts through 2035, all in US$.
Putting these cash flow projections together and discounting them back to today gives an estimated intrinsic value of about US$22.35 per share under this DCF model. Compared with the current share price of US$93.46, the model implies the stock is very expensive, with an intrinsic discount figure indicating it is 318.2% overvalued relative to this cash flow view.
Result: OVERVALUED
Our Discounted Cash Flow (DCF) analysis suggests Sempra may be overvalued by 318.2%. Discover 55 high quality undervalued stocks or create your own screener to find better value opportunities.
Approach 2: Sempra Price vs Earnings
For a profitable company, the P/E ratio is a straightforward way to see how much you are paying for each dollar of earnings. This makes it a useful check alongside a DCF model.
What counts as a normal or fair P/E partly reflects how quickly earnings are expected to grow and how risky those earnings look. Higher expected growth or lower perceived risk can justify a higher P/E, while slower growth or higher risk usually lines up with a lower multiple.
Sempra currently trades on a P/E of 34.0x. That is higher than the Integrated Utilities industry average of about 18.6x and above the peer group average of 19.9x. Simply Wall St also calculates a proprietary Fair Ratio for Sempra of 30.2x, which is the P/E level suggested after factoring in earnings growth characteristics, profit margins, industry, market cap and company specific risks.
This Fair Ratio is more tailored than a simple comparison with peers or the broad industry because it adjusts for differences in growth, risk profile and profitability rather than assuming all utilities deserve the same multiple. With Sempra’s actual P/E at 34.0x versus a Fair Ratio of 30.2x, the shares screen as expensive on this earnings based check.
Result: OVERVALUED

P/E ratios tell one story, but what if the real opportunity lies elsewhere? Start investing in legacies, not executives. Discover our 20 top founder-led companies.
Upgrade Your Decision Making: Choose your Sempra Narrative
Earlier it was mentioned that there is an even better way to understand valuation. Narratives on Simply Wall St’s Community page give you a simple way to connect your view of Sempra’s story to specific forecasts and a fair value, so you can compare that fair value to the current price, see whether your thesis points you toward buying, holding or selling, and have those views automatically refreshed when new earnings or news arrive. You might lean closer to the more optimistic US$113 fair value case that relies on earnings reaching about US$4.0b, 27.8% margins and a 20.7x P/E, or to the more cautious US$87 view that assumes lower upside from these same drivers.
Do you think there's more to the story for Sempra? Head over to our Community to see what others are saying!

This article by Simply Wall St is general in nature. We provide commentary based on historical data and analyst forecasts only using an unbiased methodology and our articles are not intended to be financial advice. It does not constitute a recommendation to buy or sell any stock, and does not take account of your objectives, or your financial situation. We aim to bring you long-term focused analysis driven by fundamental data. Note that our analysis may not factor in the latest price-sensitive company announcements or qualitative material. Simply Wall St has no position in any stocks mentioned.
Have feedback on this article? Concerned about the content? Get in touch with us directly. Alternatively, email editorial-team@simplywallst.com